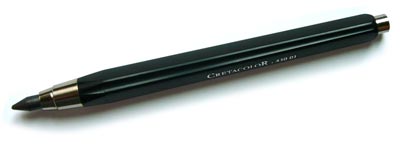
The company name “Fat Pencil” refers to the traditional drawing instrument used by architects during the early stages of conceptual design—when it’s important to get ideas on paper quickly, and avoid getting bogged down by details. Google SketchUp Pro provides a digital equivalent of this practice, and it’s been an essential tool for us since Fat Pencil Studio was founded in 2004.
Fat Pencil Studio creates technical graphics for legal, transportation, and construction professionals. Some examples are courtroom exhibits, infrastructure visualization and site logistics diagrams. Our staff have engineering and architecture backgrounds. We use this experience to develop compelling visual presentations for complex projects.
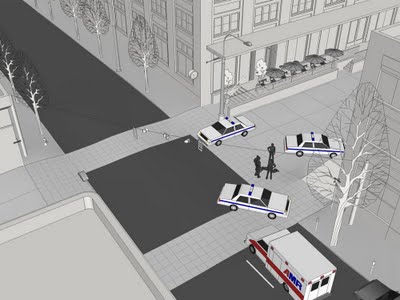
 This trial exhibit is designed to allow witnesses to identify their vantage point in a birds-eye view, and then zoom to a street-level perspective using the Position Camera tool.
Last year, we helped the City of Seattle visualize the reconfigured Broadway and Jackson Street intersection along the proposed alignment for the First Hill Streetcar extension. URS (the prime contractor for the project) had already developed 2D design drawings in AutoCAD. They needed 3D perspectives for public stakeholder meetings and regulatory filings. Once the model was created, Alta Planning (another member of the design team) was able to use it as a design tool. Each intersection could now be seen from multiple perspectives: driving, cycling, and walking. This allowed Alta to identify and address safety issues related to a two-way Cycle Track proposed for the reconfigured street.
The buildings in this area of Seattle are already in Google Earth’s 3D Buildings layer, so we initially considered importing street features into Google Earth to create a presentation. However, the difficulty of matching terrain over such a large area forced us to scrap this plan. SketchUp Pro offers more flexibility for presenting the details that matter most in this project; namely, the new street configuration. After cleaning up the AutoCAD drawings, we draped the linework over imported terrain and then added 3D features. We used several plugins to help reduce modeling time: Projections V2 helped with the curbs. Drop and RepeatCopy helped us place trees, cars, bikes and people. We also had some help from the 3D Warehouse, including an excellent streetcar model by JediCharles.
The streetcar project also gave us an opportunity to collaborate with another firm. IBI Group of Portland was responsible for station design and also modeling the southern half of the 2.5 mile streetcar alignment. Their half of the model was created in SketchUp on Windows, using terrain data from a street survey. Our half was modeled with SketchUp on a Mac, using terrain data from Google’s servers. The terrain matched almost perfectly at the seam, with only minor “smooving” needed. Using the combined model, we were able to generate dozens of still image views and several flyover animations.
Currently, we are working on a project to present options for safety improvements in a few sections of Portland’s extensive bikeway system. In this case we did not have detailed CAD drawings as a starting point; this gave us an opportunity to try a new approach for modeling street markings. Using high-resolution satellite images as a reference, we traced a single line along the center of existing markings. The PathCopy script allows us to “paint” the street markings as a series of components. Spacing can be configured for dashed lines, or set to zero for solid lines. This strategy speeds up modeling and allows global changes to the color and style of markings.


I'm impressed with how huge your model is. You got to have a really powerful machine. I tried this for my job but, even the best I could get machine was loosing frames when working in real time during presentations, though it was just an initial model. Thats why I moved my model to GIS and Google Earth. Not that detailed but still looks nice ( http://sites.google.com/site/urbaninformatik/home/projekty-zrealizowane/projektydrogowewbialymstoku )
ReplyDeleteIt is great to see my tram model being put to good use.
ReplyDelete