
SketchUp Pro 7 can generate tabular reports (fancy lists, basically) from the groups and components in your models. It's a simple operation, and provided you've set things up properly, it can save you a ton of time. Let's look at a pretty straightforward example: a picket fence.
I’m designing a simple wooden fence (SketchUp model) to encircle my yard. The fence is made from copies of three different components: Posts, Rails and Pickets. Here's what it looks like:
 My pickets fence is made from instances of three components.
I need to know how much lumber to buy, so I use SketchUp Pro to generate a report (File > Generate Report...) in CSV format which I can open in any spreadsheet program. I use Google Docs so that my spreadsheet is online. Take a look at the resulting raw report in its entirety, or view the screenshot below:
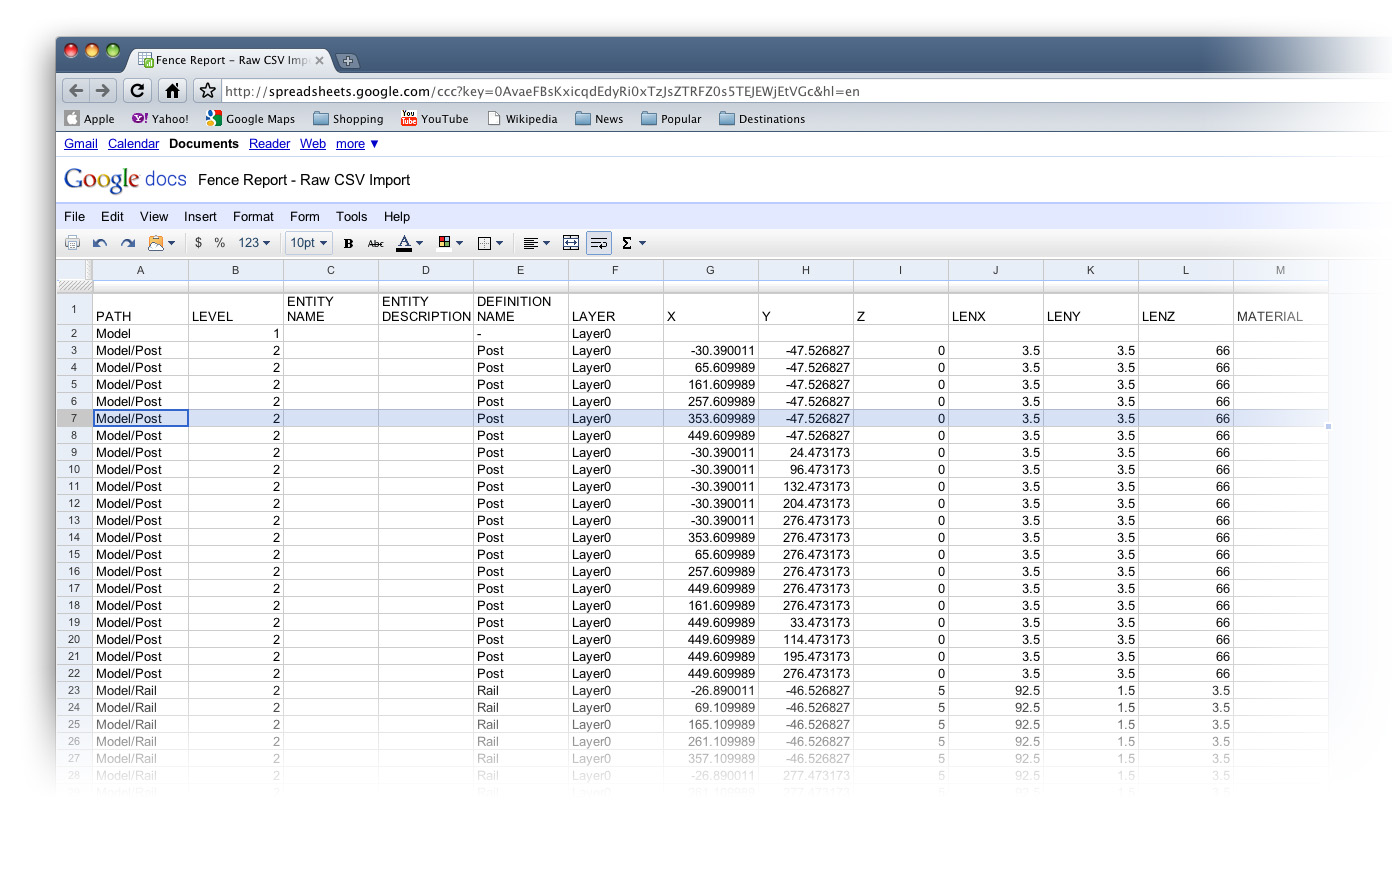 A CSV-format report from SketchUp Pro, imported into Google Docs' spreadsheet tool. (Click to enlarge)
Looking closely at the report, you can see that each component gets its own row, and that each row contains a whole bunch of information contained in a number of columns. Each column represents a different attribute associated with the component; attributes are things like "Definition Name", "Layer" and "LenZ" (length in the Z, or blue, direction).
I'm only interested in using this report to figure out how much wood I need, so I delete all of the attribute columns except the following:
- Definition Name: Tells me which component I'm looking at
- LenX: Tells me the length along the X (red) axis of the component. This is important for my rails, which span horizontally.
- LenZ: Tells me the length along the Z (blue) axis of the component. This is important for my posts and pickets, since it's their height that I'm interested in.
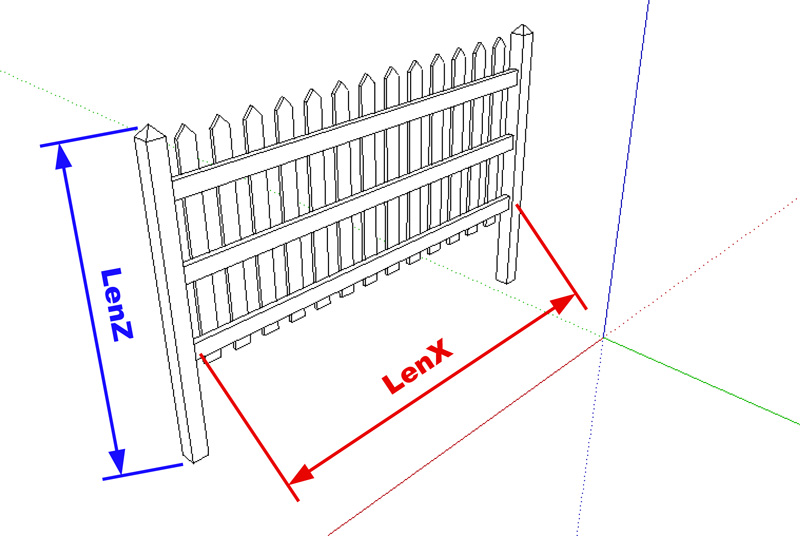 "LenZ" and "LenX" refer to lengths along the Z (blue) and X (red) axes, respectively.
Now my report is a lot easier to look at. To make is even clearer, I rename the columns. LenX becomes "Width" and LenZ becomes "Height". Lastly, I sort by the column "Definition Name" to group each component together. You can look at the complete, simplified report to see the whole thing. A screenshot is below:
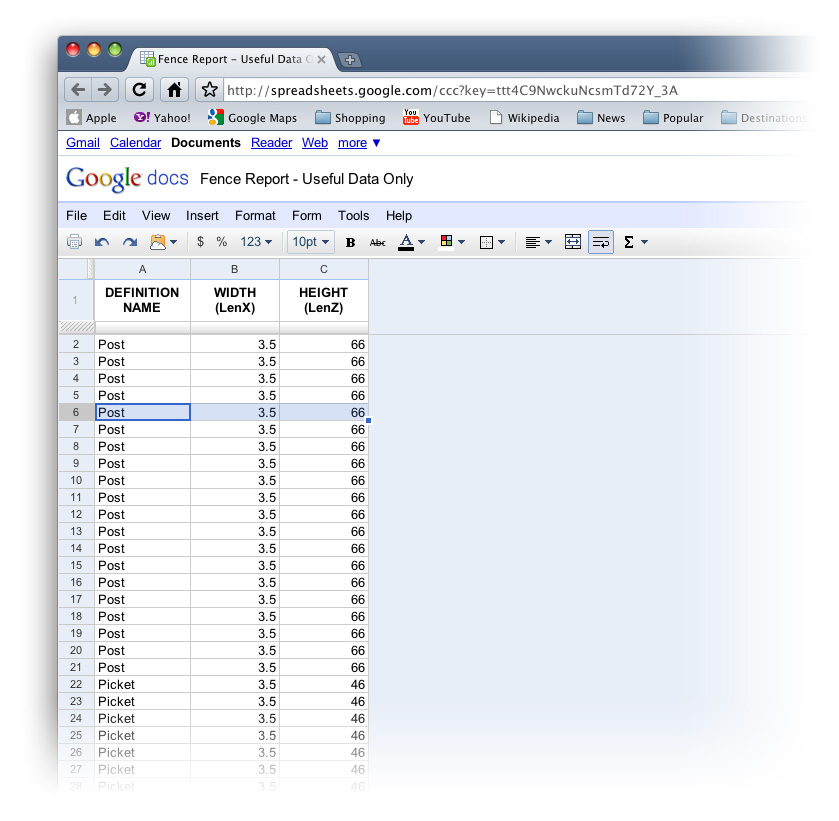 The report after I've deleted unnecessary columns and renamed the remaining ones. (Click to enlarge)
To calculate how many feet of lumber I'll need, all I have to do is sum (add together) the relevant values for each component type:
Posts: Sum all values in Height (LenZ) column for all Post components
Rails: Sum all values in Width (LenX) column for all Rail components
Pickets: Sum all values in Height (LenZ) column for all Picket components
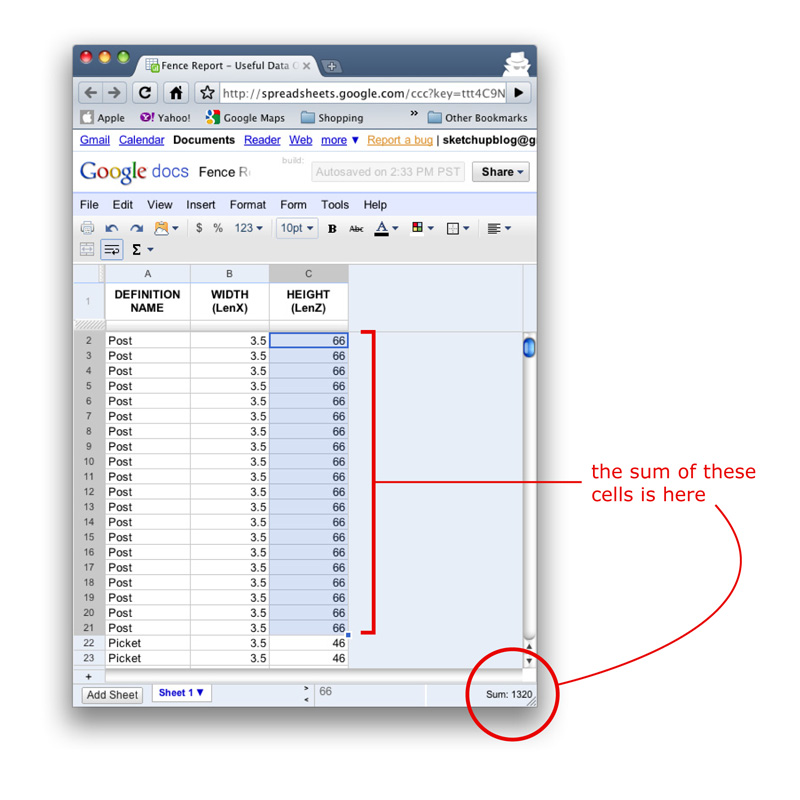 The report lets me easily sum any range of numbers. In this case, I'm figuring out how much 4x4 (3.5 x 3.5, actually) lumber I'll need for my fence posts. (Click to enlarge)
It gets better. Using custom attributes that I can assign with SketchUp Pro's Component Attributes dialog box, I can do even more. I can write a simple formula that calculates area, which would tell me how much paint to buy. I can assign a cost to each component to figure out how much this fence is going to set me back. I can create a new "Length" attribute that takes into account the kerf (thickness) of the saw blade I'll use to cut the lumber. Geeky, but 100% useful.
Stay tuned -- I'll talk about combining report generation with custom attributes in another post in a couple of weeks.
NOTE: Anticipating confusion that might ensue... The horizontal length of my fence's rails will always be LenX (red), even if I turn them 90 degrees so that they're actually oriented in the Y (green) direction. Why? Every component has its own set of axes. The width of Rail extends along the X (red) axis for that component, so I can always know its length by looking at its LenX value. Please use the comments for this post to let me know if I'm not making any sense.
Posted by Aidan Chopra, SketchUp Evangelist

13 comments :
This is the most usefull feature in Pro for my work but it needs a lot of tweeking. I curently use an old version of Cut List Materials 3.3 plug in but it does not read the diagonal lenths well. If you want to have more pro users beef the reporter up. being able to save report formats would be a lot of help. For example for quoteing steel projects or wood projects.
Cheers
Sounds really good, but I cant find it anywhere. I mean I have Sketchup Pro 7 but where is this report exactly? Please help
Hi there Lenny,
To generate a report from SketchUp Pro 7, choose File > Generate Report... from the menu bar.
Just gravitated to Pro 7 after clinging stubbornly to Version 5 for years ! Now getting into these blogs - greedy for knowledge and your tips. Big problem though: I sort of get the feeling from Pro 7 that it assumes the user knows architect stuff and terminology. Also, stuff like Style Builder is scary. How does it work ? Will it screw my drawing if I get it wrong and can't find my way back ? Need bite-size instructions to get the best from Pro 7. What do you guys suggest ?
HI Aidan, I have a few questions. I have exported many reports in the past but I did not know i could export to google docs. Did you export to excel and then copy paste to google docs or did you export straight to google docs? If so could you let us all know how?
Now we have a list of materials from the model, I guess the next step would be to create a shedule from the model.... here is a tip: I simply assign a layer to the 3 components. Obviouosly the post would go in first. so say we put it on a renamed layer call it: "1post" then put the rails on renamed layer: "2rail" then the pickets on layer: 3pickets. This will enable you to sort (spread sheet) by layer (column F http://4.bp.blogspot.com/_mDRU50FpD-E/S5E8Pze1PDI/AAAAAAAAADs/eiKZhO8W7Ug/s1600-h/Raw+Report.jpg) which will give you a shedule. On an easy job such as this you may not need a shedule but a more complex job eg a house its great to have shedule from your report. If you have your shedule on seperate sheet (sheet2) of your spreed sheet you now have a material list on sheet 1 and a shedule of works on sheet 2. Simply attach a date next to the layer because its on line (google docs) you can share the shedule between the lumber supplier and the contractor doing the work. Sketchup is cool
You neglect to mention that you can change the axis of any component. You can also turn on "show component axis" in the Model Info window so you can see at a glance how they are all lined up. This allows you to define what you want the length, width, and thickness of any component to be.
I use this to create cutting lists for all the parts in a set of kitchen cabinets. I would like to be able to customize the reports so that I could eliminate and organize columns before the report is generated.
Aiden, could you tell us how to save the report in google docs? can it be done directly?
my model was in metric units, but the report printed in inches;
can i select units for the report?
Andrew: To open a report in Google Docs, create a new spreadsheet, then choose File > Import and select the CSV you exported from SU. It should open as a new spreadsheet file in Docs.
Roger: Right now, reports are only available in inches. It's a fairly trivial thing to convert inches to metric units in your spreadsheet, be we realize this isn't ideal. Thanks for reminding us to keep at it!
how to work the fabrication of steel structures, especially looking at the structure of the steel plate concrete floor, a long iron to get a quick overall building
It seems that four years later reports generated with the Generate Report function are still NOT available in metric units - rather a poor show!
Post a Comment